

Power amplifiers present a unique set of testing challenges that are usually not encountered with digital or low-level analog circuits, as they must supply significant current as well as voltage to their loads. This comprehensive checklist on what is needed for testing power amplifiers covers the fundamental measurements, with specifics on how to best accomplish the tests using Audio Precision’s APx series audio analyzers and APx500 measurement software.

Power amplifiers present a unique set of testing challenges that are usually not encountered with digital or low-level analog circuits, as they must supply significant current as well as voltage to their loads. Factors such as power supply current and voltage limitations, thermal characteristics of the output devices and associated heatsinks, and the resistive and reactive components of the load must be considered to produce meaningful results. Whether it’s high-powered amplifiers for venues, headphone amplifiers, or small chips in hand-held devices, many of the same considerations and test procedures described in this article may be applied.
Measurement Equipment
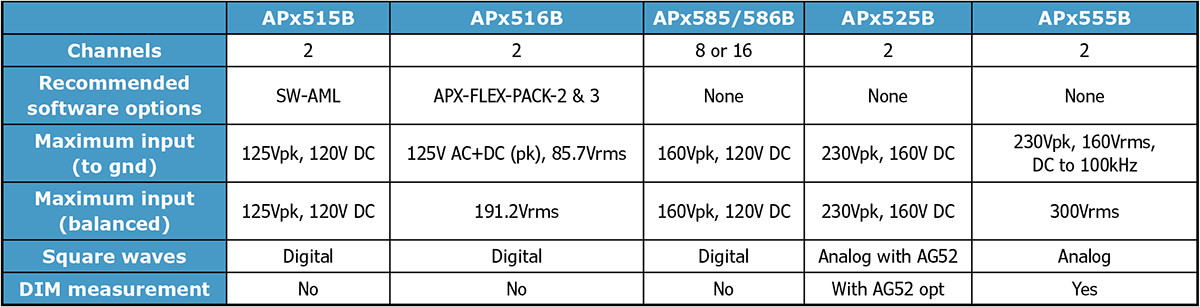
A wide variety of APx500 audio analyzers, controlled by APx500 software, may be used for audio power amplifier measurements. These are listed in Table 1, with a comparison of the features and specifications that are most pertinent to power amplifier testing.
Audio Precision’s APx500 Flex software may also be used with third-party audio interfaces that support ASIO. However, because audio interfaces don’t have input ranging, they can’t handle the voltage levels of moderate-sized power amplifiers, nor can they measure very low levels without introducing noise.
Dummy loads are required for almost all amplifier tests. They must be non-inductive and should be of sufficient size and properly heatsinked to endure the full output power of the amplifier under test. The Dale NH series wire-wound resistors with 1% tolerance are a popular choice. For small amplifiers, precision thin-film metal film resistors with a low temperature coefficient may be used. A practical configuration is to parallel 8Ω resistors for 4Ω measurements. Headphone amplifiers will require other loads, such as 32Ω, 100Ω, and 600Ω.
Filterless Class-D amplifiers are a special case, as their design relies on the inductance of the connected speaker to form a low-pass filter. Testing them with a purely resistive load may affect the results and not reflect actual field performance.
When testing Class-D amplifiers, an Audio Precision AUX-0025, 0040, or 0100 switching amplifier measurement filter should be inserted in series with the analyzer inputs to filter out carrier components that might cause overload and therefore erroneous readings (Figure 1). Low-pass filtering should still be configured in the software.
Connections
Connect the analyzer outputs to the amplifier inputs, and the amplifier outputs to the analyzer inputs, as well as to the dummy loads. Class-D amplifiers often have a DC bias on their outputs and must be connected to the analyzer’s balanced inputs. Size the speaker wires so there’s negligible voltage drop.
Pay close attention to the grounding configuration to minimize external noise and hum pickup. For balanced connections, lifting the shield at one end may reduce ground noise. You can find the configuration with the lowest noise using the RMS Level result and the FFT Spectrum Monitor in Signal Path Setup. Make sure that you have minimal line voltage drop when testing high power amplifiers with unregulated power supplies, as this will affect the power output measurements. A rheostat may be used to adjust the line voltage.
References Levels
A number of power amplifier measurements are typically done driven to an output power of 1W. To automatically establish this as a generator reference level, go to Signal Path Setup > References > Auto Gen Level to set dBrG units to 0dB.
For results using watts as a unit, the reference impedance must be set in Signal Path Setup. The best way to avoid errors is to create two signal paths with a reference of 8Ω in Signal Path1 and 4Ω in Signal Path2.
Additional Setup
Bandwidth and/or low-pass filters are typically set for 20kHz. Use of the sharp cut-off AES17 20kHz filter is especially important for testing Class-D amplifiers. If you use DC coupling, make sure to check for DC across the amplifier outputs using the APx500 DC level measurement, with and without signal present.
Tests and Measurements
In the following sections, we will review common amplifier tests and how to best perform them with APx500 software in Sequence Mode. To avoid confusion, we will use “test” to refer to the parameter being measured, “measurement” to refer to specific APx500 measurements, and “result” to refer to the graphs in the filmstrip display at the bottom of the screen. Many tests can also be performed using APx500’s Bench Mode.
Power Output
Power output is one of the most fundamental power amplifier parameters to test, and the APx500 software provides multiple measurements to do it. Perhaps more than any other test, the results are highly sensitive to the conditions under which they are made and the methodology used.
Factors that influence the test include frequency range, reference distortion level, number of channels driven simultaneously, warm-up procedure, duration of the test tone, ambient temperature, type of test signal, and load.
The United States Federal Trade Commission developed the “Amplifier Rule” to define the test parameters for home entertainment products in the US. Regardless of whether or not you are testing for FTC compliance, the rule serves as a good starting point. The latest version, pending ratification, states:
“Any power level from 250mW to the rated power shall be obtainable at all frequencies within the rated power band of 20 Hz to 20 kHz without exceeding 1.0% of total harmonic distortion plus noise (THD+N) at an impedance of 8 ohms after input signals at said frequencies have been continuously applied at full rated power for not less than five (5) minutes at the amplifier’s auxiliary input…”
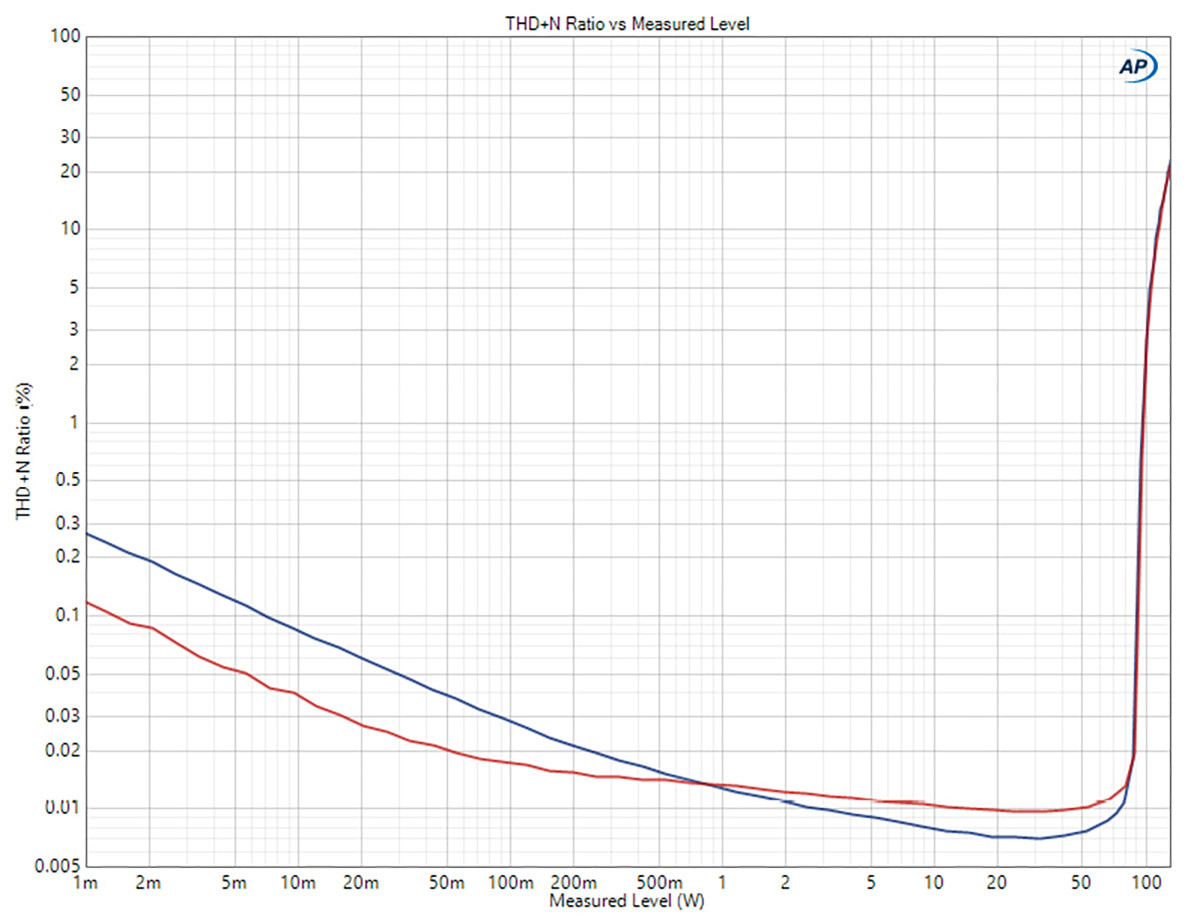
There are two APx500 measurements that are useful for doing power tests: Stepped Level Sweep and creating the classic THD+N vs. power curve (Figure 2), which provides a view of distortion and noise across a wide range of power levels and shows the characteristics of the inflection point where the amplifier starts to clip.
Maximum Output Level
The Maximum Output Level measurement finds the maximum output power by iterating the generator level until a target distortion level is achieved. If the measurement fails to find the maximum level, it may be necessary to adjust the start level or the number of initial steps.
Maximum Output Level CEA-2006 uses a 1kHz or 50Hz sine wave burst to reduce heat buildup when testing amplifiers that cannot tolerate a continuous test signal for long enough to get valid power readings. The 50Hz signal is also useful for testing dynamic headroom, which is the extra output that an amplifier can provide for the short transients in typical musical program material.
Maximum input level (often called “sensitivity”) can be obtained from the Generator Level result of the Maximum Output Level or Maximum Output Level CEA-2006 measurements.
Practical speakers present a complex impedance load to an amplifier, and a full investigation of performance should include testing with reactive as well as purely resistive loads. This can be accomplished by manually attaching components in series or parallel with the dummy loads, or by using an adjustable load, such as the AudioGraph Active Loadbox, for which AP provides a utility for automated testing.
Measurement Recorder
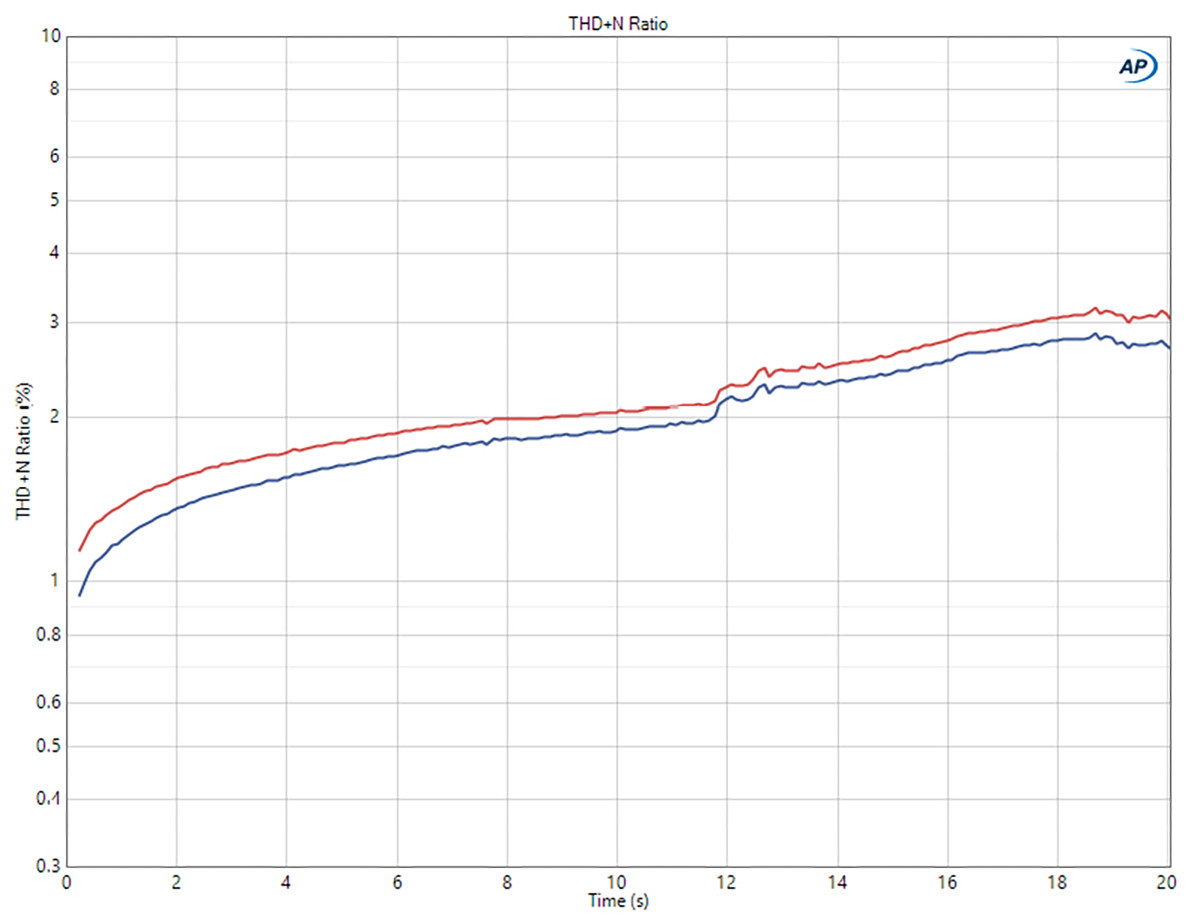
A Measurement Recorder makes multiple measurements over a defined period of time and can be a very powerful tool for observing the behavior of amplifiers where heat buildup is an issue. A common technique is to apply a signal at just below clipping and observe the THD or THD+N results over time (Figure 3). In some amplifiers, these will steadily rise unless preheat and cool-down times are carefully controlled.
Frequency Response
The APx500 software provides multiple methods for capturing frequency response, with Continuous Sweep being the fastest. Testing is typically performed with a power output of 1W, but it can also be performed at different levels to observe for any changes. Frequency response is usually stated as the range of frequencies where level does not deviate by more than a specific amount (usually ±3dB), or as the amount of level deviation between two predetermined frequencies. For the former, the Continuous Sweep Relative Level result automatically normalizes the response curve and shows the exact frequencies that cross-specified limits. For the latter, the Deviation result shows the amount of deviation between two selected frequencies.
Some Class-D amplifier designs have LC output filters that interact with the load impedance, causing significant variations in the response curve. In these cases, it is especially important to run the frequency response test multiple times with different loads. It should be remembered, however, that the actual impedance of speakers is highly frequency dependent. Therefore, the frequency response of these amplifiers in practical usage may not correlate well with the test results.
Power Bandwidth
Power bandwidth is the range of frequencies within which an amplifier can produce full output power. The full power measurement is made by establishing the maximum output at 1kHz and then running a frequency response sweep at that level. If the THD+N does not stay at or below the specified percentage at all frequencies in the specified test range (typically 20Hz to 20kHz), then the generator level is lowered slightly and the test is run again.
Another way to test the power bandwidth is to use the Regulated Frequency Sweep measurement. It is essentially a combination of Maximum Output Level with a Stepped Frequency Sweep, where the generator level is increased at each step until THD+N exceeds a preset amount. The analyzer bandwidth will need to be widened to include the distortion products of the higher frequencies — otherwise, the regulation will never settle because THD+N will remain too low. Because the results are independent of frequency response, this measurement will not produce numbers that can be used in a typical power bandwidth specification.
Noise
Signal-to-noise ratio (SNR) — sometimes called dynamic range or hum and noise — may be automatically measured using the Signal to Noise Ratio measurement. Although sometimes specified with respect to full power output, a measurement at 1W makes a comparison with standards and other amplifiers more valid. The absolute output noise level may be measured using the Level and Gain measurement. Amplifier inputs should remain connected to the analyzer outputs even when the generator is off, so that they are back-terminated with the correct impedance.
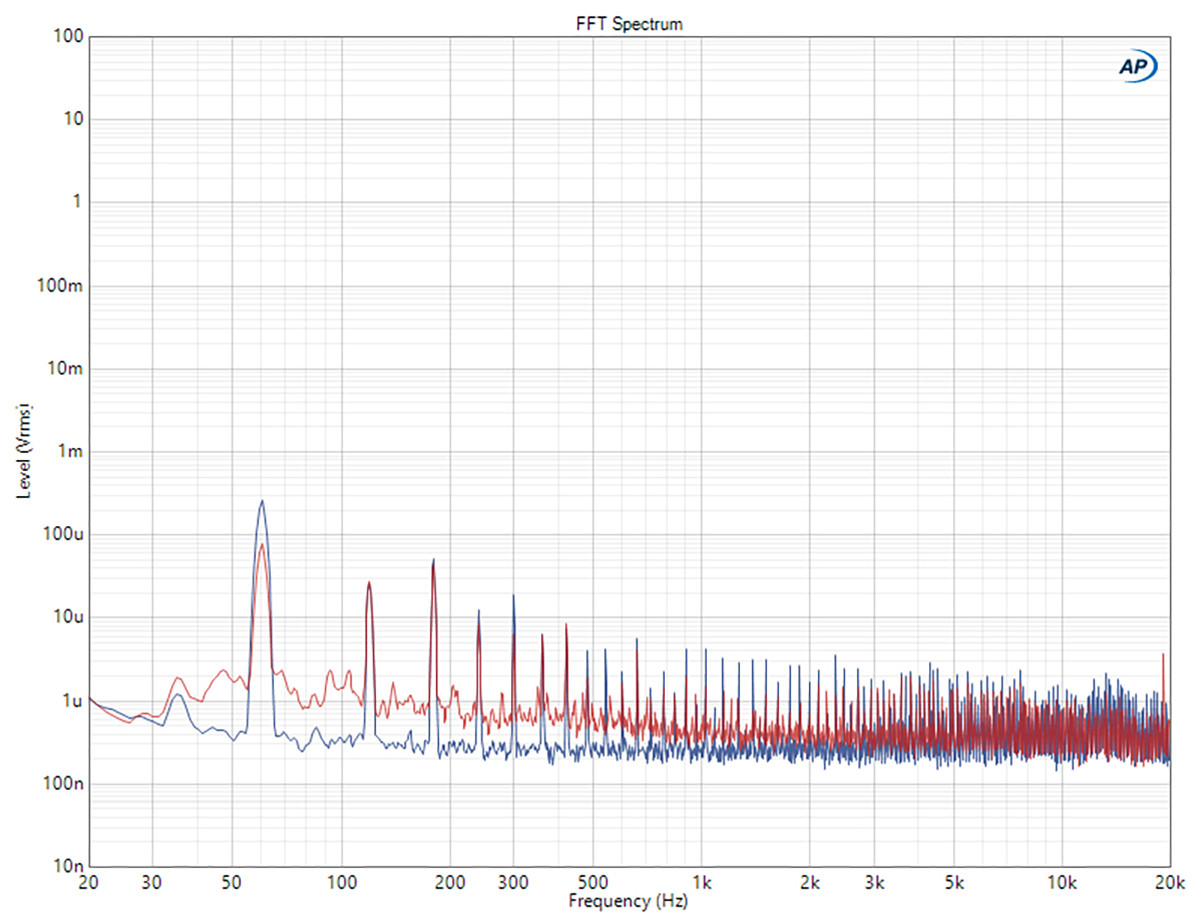
Both SNR and absolute noise level are typically measured utilizing a bandwidth of 20Hz to 20kHz, utilizing a sharp low-pass filter at 20kHz. Careful attention must be given to several factors to obtain accurate results, including the quality and orientation of the cables, the presence of ground loops, and the existence of nearby external hum and noise sources. To aid in identifying and eliminating these issues, the noise spectrum (Figure 4) may be visualized using the Signal Analyzer measurement in Sequence Mode, or the FFT measurement in Bench Mode.
Harmonic Distortion
The classic THD+N vs level graph for amplifiers may be produced by running the Stepped Level Sweep measurement. This gives insight into the lowest achievable level, and the behavior of the amplifier as it approaches clipping. For single-point tests at a fixed frequency and level, there’s a measurement simply called THD+N.
To observe harmonic distortion at a fixed level across the audible bandwidth of 20Hz to 20kHz, the Continuous Sweep or Stepped Frequency Sweep measurements may be used. Continuous Sweep also allows you to enable nested levels, creating an appended graph at multiple generator levels settings.
The Stepped Level Sweep, Stepped Frequency Sweep, Continuous Sweep, and THD+N measurements all produce a set of harmonic distortion results that not only include THD+N, but also THD as well as individual harmonics and groups of harmonics. The distribution of distortion products across the frequency spectrum may also be observed using the Signal Analyzer measurement.
Intermodulation Distortion
Intermodulation distortion (IMD) tests utilize two simultaneous signals to create intermodulation products. The intent is to measure performance characteristics that may not be revealed by using a single-tone stimulus, and to observe distortion at higher frequencies, since all distortion products are in-band. Slew-rate limiting, for example, will cause an increase in IMD, but may not be revealed in THD+N tests.
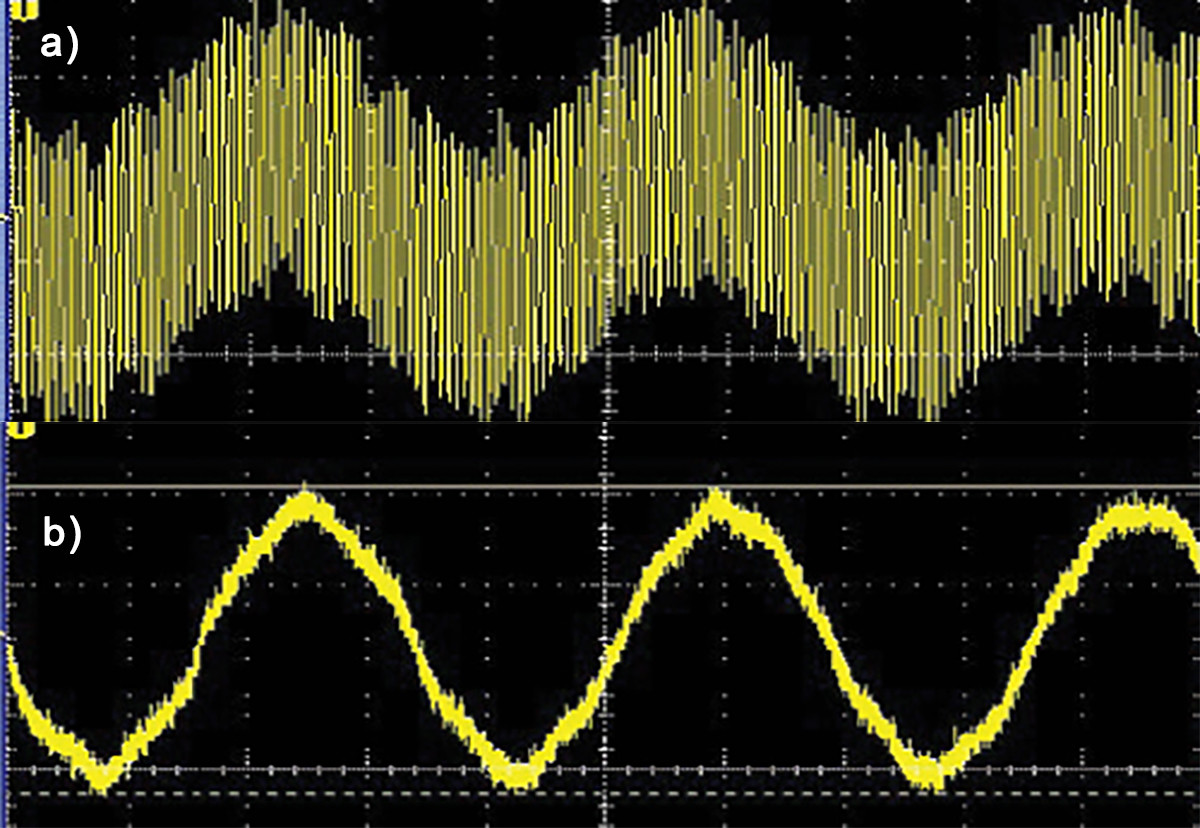
Dynamic intermodulation or transient intermodulation (DIM/TIM) distortion testing is specifically intended for power amplifiers. APx500 provides both the DIM Level Sweep and DIM measurements, which use a signal comprised of a square wave and a sine wave. Because DIM testing requires a high-quality analog square wave generator, it is only available when using the APx555 analyzer or the APx525 analyzer with the AG52 option (Figure 5).
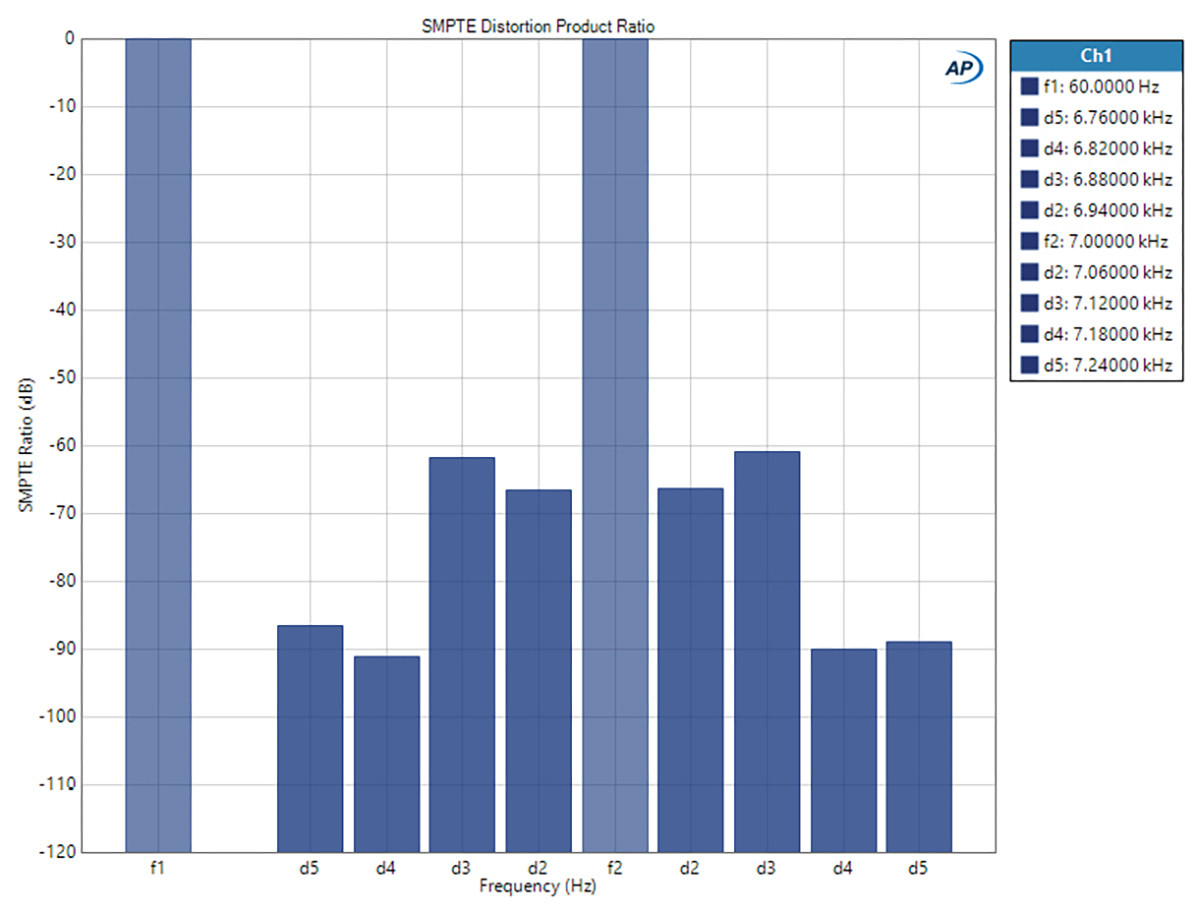
For the more common IMD tests, APx500 provides for swept and fixed testing utilizing the IMD Level Sweep, IMD Frequency Sweep, and IMD measurements. Each of these may be configured to measure SMPTE, DFD, CCIF, and MOD IMD, at both standards-defined and user-defined frequency combinations.
Gain
Gain, expressed as a ratio in decibels (dB) between the input and output voltages, is a common specification for power amplifiers. It is available in numerous APx500 measurements as one of the primary results.
Damping Factor
Damping Factor is the ratio of speaker load impedance to amplifier output impedance. Although a single-point measurement can be taken, it is more informative to measure it across the entire bandwidth of the amplifier. To capture the data, a level sweep in Vrms is made with no load connected to the amplifier, and then a second sweep is made with an 8Ω resistive load attached. AP offers the APx Damping Factor Measurement Utility to automatically calculate the ratio.
Phase
Phase can best be seen on the Phase result of the Continuous Sweep measurement. For accurate high-frequency phase results, low-pass filters should be removed, and the analyzer bandwidth should be set to 20kHz or greater.
Crosstalk
Crosstalk can be observed using the single-point crosstalk measurements, or the Crosstalk results of the Continuous Sweep or Multitone measurements. Twisted-pair speaker cables, with separation between each channel, should be utilized to avoid measurement errors.
CMRR
Common mode rejection ratio (CMRR) should be tested on amplifiers with balanced inputs. It can be measured using the CMRR and CMRR IEC measurements and APx500 analyzers that have the necessary hardware built in (APx515B, APx516B, APx525B, and APx555B). For the APx585B, CMRR can be tested by constructing external cabling and utilizing the Level and Gain measurement.
Conclusion
This article has covered many of the typical audio tests normally done on power amplifiers in design, review, and production test. Visit www.ap.com for other amplifier testing resources, as well as an expanded version of this article. And, reach out to AP’s tech support if you have any questions. aX
This article was originally published in audioXpress, March 2025
Source link


")
